I’ve been a pretty big fan of Skritter since a few years, but I find that more and more parts of it become deprecated, while not enabling these features in the new app / website versions.
For my general habit tracking, I also track minutes of Skritter per day/month/year - the only way I’ve been able to do this for a while now is in the legacy web page, as
In the new (iOS) app, there’s no real stats section yet
In the new web page, there seems to be a bug with time zones(?), as shown in the attached screenshot: I studied 36 mins today (as also correctly identified in the above green circle), however this is shown as yesterday’s time - also, while there is a drop-down to choose custom date ranges, the diagram does not update accordingly
In the old (iOS) app, only the daily stats work
Since a week or so, now also the legacy dashboard seems to be broken, as instead of the diagrams only a white canvas is shown.
It would be greatly appreciated if you would make this feature available (again) at least in one of the above-mentioned options. As I said earlier, I have been a a pretty big fan for years, however I do find the mixture of versions and depreciated / not yet developed functionality over the different platforms quite annoying / close to unacceptable - especially given the price tag.
We’re going to be doing a massive stats overhaul and this will be improved on the iOS app and web version!
I’m able to reproduce the issue with the legacy progress area, thanks for calling this to our attention. I’ve opened a ticket for the developers to look into.
I checked my progress today on the legacy website (also wishing these details were available on new apps) and found the charts broken. No graphs anymore.
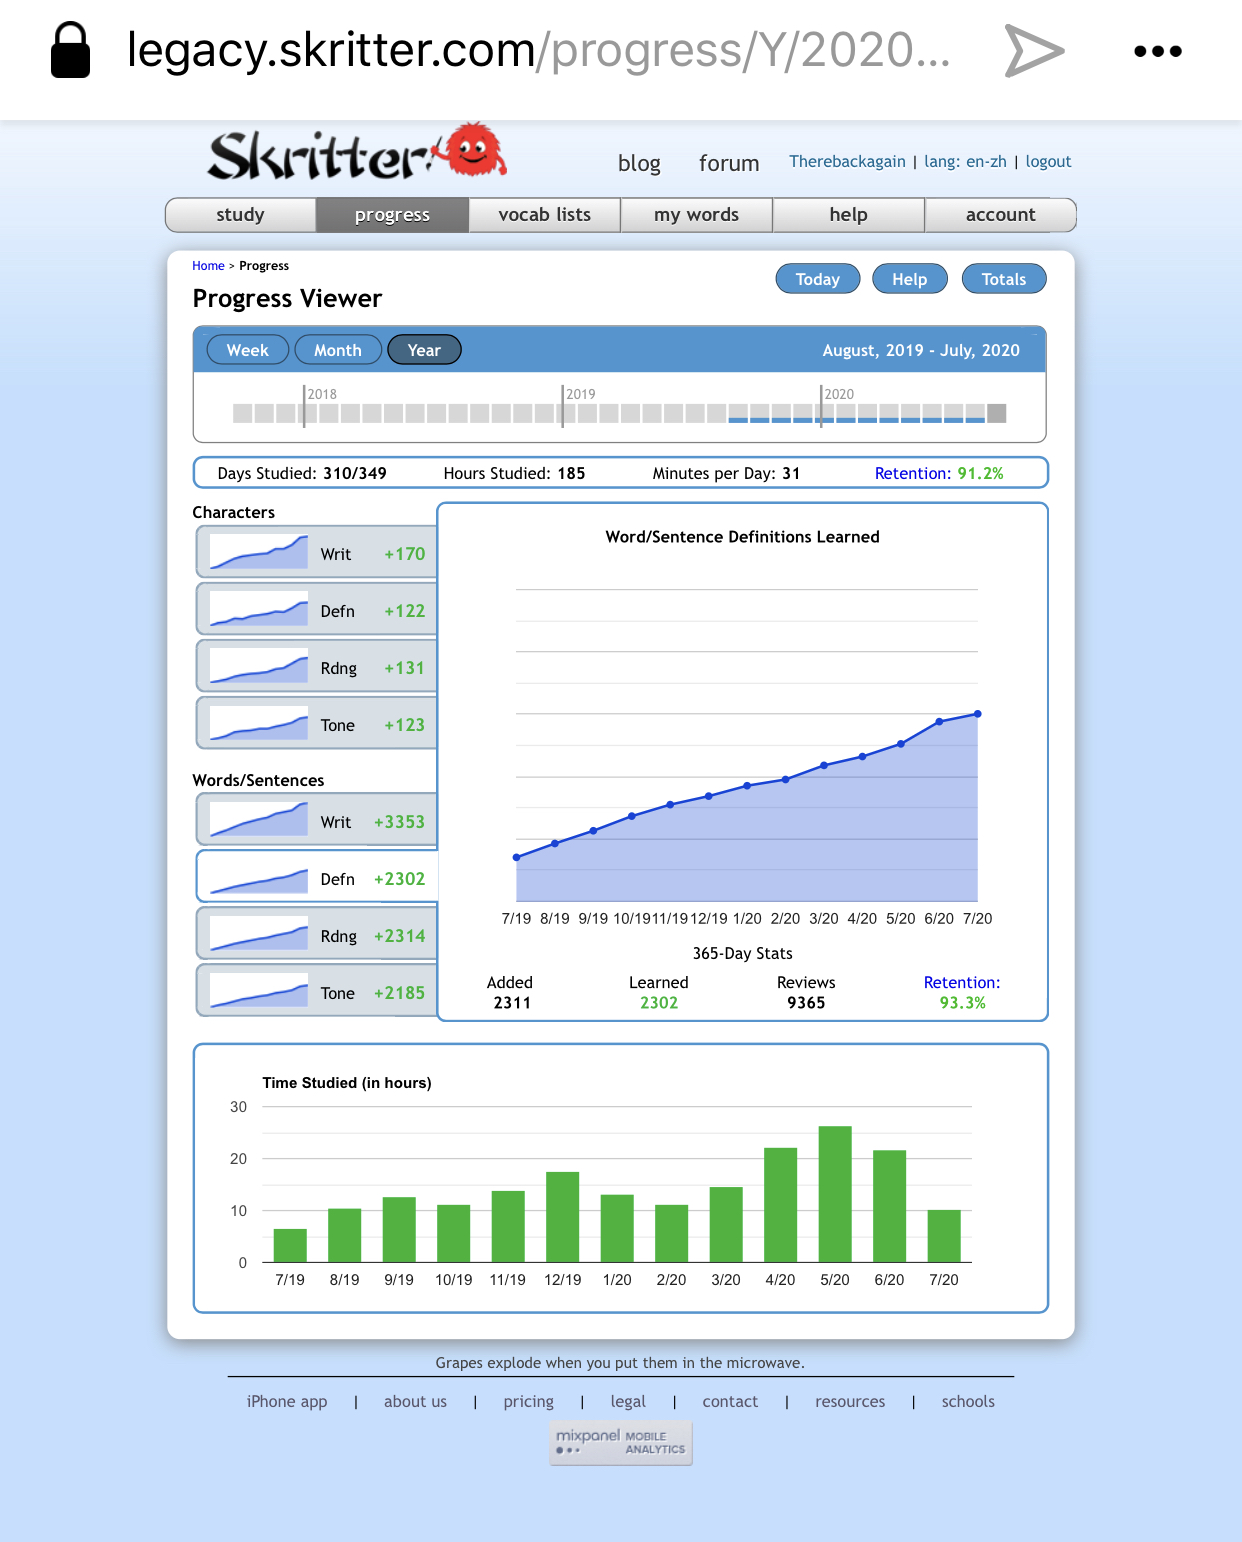
Shame as this is a great tool for monitoring one’s progress, especially by parts studied, and love the day/week/month/year graphs.
Edit: Actually clicking through the graphs, I see that the y-axis label is only shown for the first graph, but not for the other 7 - not super tragic, as the relevant values are shown with onmouseover, but I guess a bug nevertheless.
On checking today I notice the missing Y-axis is all over the map: it is missing for some categories in both words and characters, and present for others, all different depending on whether one is viewing days, weeks or months.